Frequency response at the ear drum
Apr 27, 2024 at 3:06 PM Post #256 of 283
I'll have to process and read some more on this to understand. I can get to the same measurement methodology (sine sweep recording) producing multiple graphs, that makes sense because all the data is there to calculate the FR, IR, CSD, THD, and whatever else. I'm just struggling to understand how you could extrapolate the system's behavior from just the FR.
There's a abstract kind of system that is called a "Linear Time-Invariant system". Anything can be considered a system (just not necessarily LTI system) that has at least one input and at least one output. It's especially useful if an actual, real-world physical system can be represented properly by mathematical concepts such as functions, equations, vectors, matrices and so on. Headphones and IEMs are systems that has an input which could be voltage changing over time and that can be represented by a simple, single variable function. The output could be pressure changing over time or the placement of the membrane changing over time (again, something that can be represented by a simple function), so a headphone, or any transducer can be just a single input single output system in a mathematical sense.

An LTI system has certain properties (as the name would imply) that restricts how it behaves so it is simple enough to be entirely described by a single equation. Using this equation, one can tell what the exact output would be for the system for any input signal, and one could also tell what the exact input was based on just the output. The overview section of the wiki article about LTI system explains the fundamentals of what an LTI system is and how a single function can be used to describe it in its entirety. I hate to just throw out a wiki article as if I've done something useful but there must be so much information on this topic because every year, thousands of people have to pass an exam on this exact same topic so I assume the internet is filled to the brim with lectures and courses geared towards people who want to understand this.

Something to note is that headphones are not linear nor time-invariant, however, one could argue that an ideal headphone is an LTI system and for practical purposes, their behaviour is close enough to an LTI system.
 
Last edited:
Apr 27, 2024 at 3:48 PM Post #257 of 283
I'm not a math Asian so I'm trying to wrap my head around this a bit ineptly, but I can't help but think an assumption is being made here that multi-driver systems that combine different driver operating principles are by definition minimum phase because they are indistinguishable from another? Mathematically reconstructing the IR from the FR in a continuous time function like audio transducers seems to require several assumptions like this which I don't believe are necessarily true, although I can feasibly conceptualize the inverse being true (you can derive the FR by conducting a fourier transform of the IR).

If the multi-driver configuration consists of multiple drivers with the same operating principle properly phase aligned at the nozzle, I can get to the system being assumed to be minimum phase. What I don't think is correct is assuming that hybrid and tribrid configurations are automatically minimum phase because of discrepancies in performance characteristics between operating principles which further complicates the issue.

I'll have to process and read some more on this to understand. I can get to the same measurement methodology (sine sweep recording) producing multiple graphs, that makes sense because all the data is there to calculate the FR, IR, CSD, THD, and whatever else. I'm just struggling to understand how you could extrapolate the system's behavior from just the FR.
Usually, manufacturers of multi-driver IEMs make sure that the phase response of the drivers are matched with each other, any remaining mismatch will be negligible.

The second point is just maths and assumptions about the system. Ignoring the negligible non-linearity and phase-mismatch problems of the IEMs, they are then linear time-invariant and minimum-phase. Then, all the information about the system is indeed contained in the magnitude response (which doesn't need to talk about phase response at all and which you can easily derive from a sine sweep that doesn't even measure phase differences between the input and output, and just the magnitude of the output), from which you can derive the frequency response, and then the impulse response. For linear time-invariant systems, you can derive the FR from the IR and the IR from the FR; for minimum-phase systems, you can derive the phrase response from the magnitude response via the Hilbert Transform, and then you combine the magnitude response and the phase response to get the frequency response.
 
Apr 27, 2024 at 3:54 PM Post #258 of 283
I would think that the individual’s HRTF would need to be factored in for a truly accurate measurement. Wouldn’t the HRTF affect the response curve like the room affects it for speakers?

Is it correct to think of HRTF in the same way as you think about a room? (Naturally, listening to speakers in a room has the HRTF built in.)
 
Last edited:
Apr 27, 2024 at 5:15 PM Post #259 of 283
How is it possible that you don’t know “what BS”, when you made it up yourself? How is your response anything other than yet more BS, especially as you stated “i guess we leave it now at this and you guys can continue the thread...”?!
You can feel free to delete my posts calling a spade a spade, but his squirrely games make him look less than honest a lot more than my posts do. Online, people use anonymity to play games. You can clearly see what proportion of people are working the system in the left hand column of that chart. It isn’t a lot of people. It’s just a handful that cause most of the problems.

When people like this are allowed to self aggrandizingly parade around making uncontovertably false claims and personal attacks on forum regulars, this is what we get. Everything grinds to a halt. The problem isn’t the false claims nor the attacks, it’s that they have no interest in the general discussion. They only want to tear down and draw attention to themselves. It’s an attitude thing and it isn’t at all subtle. We all can spot it quickly. If they don’t want to participate as part of the group, they should be invited to go to a forum that will appreciate them more.

there is a german saying that is pretty fitting

"As one calls/talk into the forest, so does it call/talk back"

and its really not my problem if some objetivitsts feel "attacked" in their worldview or whatever
 
Last edited:
Apr 27, 2024 at 7:00 PM Post #260 of 283
@Doltonius @VNandor
Maybe it'll be easier to describe my conceptualization of what is going on to make sure we are on the same page.

So at the ADC, we record magnitude across time at discrete time intervals (whatever sampling rate it is) and run this data set through a FFT to get the frequency response. In theory, you can then run the FR through an IFFT to reconstruct the original recorded signal to recover the IR used to get the FR, is this right?

The last part is not an intuitive concept to me, I'm trying to understand this through considering the inherent time domain information contained in the frequency itself, but something isn't clicking for me here.
 
Apr 27, 2024 at 9:02 PM Post #261 of 283
@Doltonius @VNandor
Maybe it'll be easier to describe my conceptualization of what is going on to make sure we are on the same page.

So at the ADC, we record magnitude across time at discrete time intervals (whatever sampling rate it is) and run this data set through a FFT to get the frequency response. In theory, you can then run the FR through an IFFT to reconstruct the original recorded signal to recover the IR used to get the FR, is this right?

The last part is not an intuitive concept to me, I'm trying to understand this through considering the inherent time domain information contained in the frequency itself, but something isn't clicking for me here.
The missing piece is that our usual frequency response graphs don't actually tell us the frequency response directly. Strictly speaking, frequency response contains time-domain information, i.e., the phase of each frequency. With that, if you line up the frequencies with the right amplitude and at the right phase angles, you can really reconstruct the original waveform via Inverse Fourier Transform. The FR graphs we usually see only tell us the amplitude of each frequency. The time-domain information is deduced from the property of IEMs being minimum-phase. Minimum-phase systems have the property that phase response is uniquely determined by the magnitude response via Hilbert Transform, which makes including the phase information in the graph unnecessary; in IEMs that is basically determined by the amplitude of each frequency. So there is the time-domain information contained in the FR graphs we see after all, thanks to the minimum-phase property.
 
Apr 27, 2024 at 9:38 PM Post #262 of 283
The missing piece is that our usual frequency response graphs don't actually tell us the frequency response directly. Strictly speaking, frequency response contains time-domain information, i.e., the phase of each frequency. With that, if you line up the frequencies with the right amplitude and at the right phase angles, you can really reconstruct the original waveform via Inverse Fourier Transform. The FR graphs we usually see only tell us the amplitude of each frequency. The time-domain information is deduced from the property of IEMs being minimum-phase. Minimum-phase systems have the property that phase response is uniquely determined by the magnitude response via Hilbert Transform, which makes including the phase information in the graph unnecessary; in IEMs that is basically determined by the amplitude of each frequency. So there is the time-domain information contained in the FR graphs we see after all, thanks to the minimum-phase property.
I can't get there, the FR will not comprehensibly describe irregular decay and resonance behaviors that can not be displayed outside of a CSD because those behaviors are not necessarily occurring alongside the same minimum phase impulse that the FR is derived from. I think it makes sense that those artifacts could possibly be recorded on the FR graph during the FFT, but you wouldn't possibly be able to parse what that means without seeing the CSD graph putting those artifacts into context.

I don't think I can be convinced anymore that an FR graph is all I need to understand what's going on, it's ignoring too many potential snags and variables that seem to be significant because EQ matching can not perfectly replicate sound across devices. If you could walk me through how you would solve for the FR of a QDC VX and FF MSE describing the post impulse decay and resonance characteristics that are described by the CSD without seeing anything besides the FR, I might change my mind, but I'm not seeing how that is possible.
 
Apr 27, 2024 at 9:53 PM Post #263 of 283
Time isn't much of a problem with digital audio and in or over ear transducers. That is a problem you encounter with analog audio and the effect of a room on speakers... unless your goal is to create a spatial presentation that mimics speakers in a room. Otherwise, frequency and amplitude are what you need to tame.
 
Last edited:
Apr 28, 2024 at 1:44 AM Post #264 of 283
I can't get there, the FR will not comprehensibly describe irregular decay and resonance behaviors that can not be displayed outside of a CSD because those behaviors are not necessarily occurring alongside the same minimum phase impulse that the FR is derived from. I think it makes sense that those artifacts could possibly be recorded on the FR graph during the FFT, but you wouldn't possibly be able to parse what that means without seeing the CSD graph putting those artifacts into context.

Can't you simply look at excess group delay to know whether or not a system is minimum phase ?
In which case headphones tend to be quite boring in that regard, and it's rare (but can occur) that there is a non-minimum phase feature in excess group delay graphs.

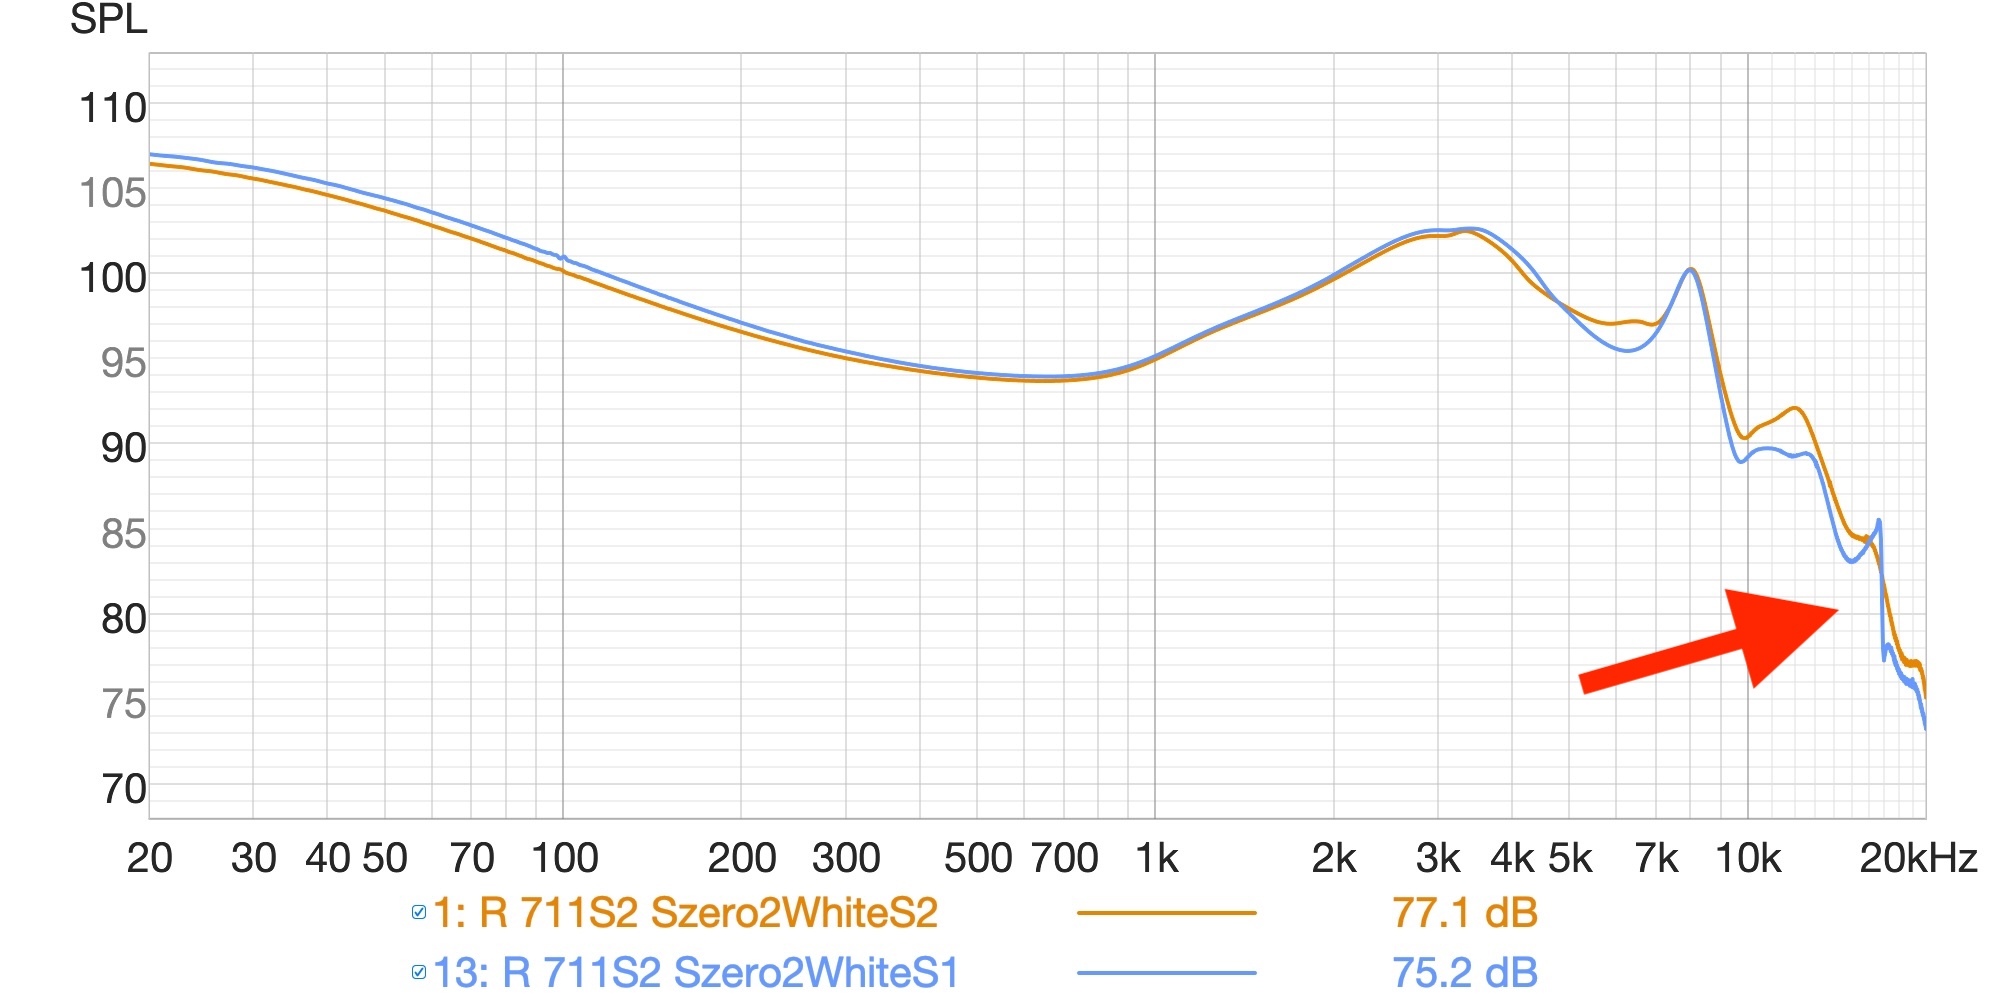
I've recently measured three samples of the 7Hz Salnotes Zero 2. Two of these measured with a weird feature around 17kHz on both earbuds, visible here for one sample compared to the "normal" one :

Szero 2 min phase FR.jpg


If I plot their respective excess group delay graphs after 1/48 smoothing :

Szero non min phase blip.jpg
Szero  min phase.jpg


You can see that one of them shows the same sort of "blip" at that frequency. Please ignore the spikes / wiggles at lower frequencies, this is just noise.

I haven't run into many headphones where these phenomena occur - including a few multi drivers IEMs, but I haven't measured a lot of them - but they occasionally do (ex Beyer DT 900 Pro X at the 4kHz dip).
 
Apr 28, 2024 at 2:50 AM Post #265 of 283
Can't you simply look at excess group delay to know whether or not a system is minimum phase ?
In which case headphones tend to be quite boring in that regard, and it's rare (but can occur) that there is a non-minimum phase feature in excess group delay graphs.

I've recently measured three samples of the 7Hz Salnotes Zero 2. Two of these measured with a weird feature around 17kHz on both earbuds, visible here for one sample compared to the "normal" one :

Szero 2 min phase FR.jpg

If I plot their respective excess group delay graphs after 1/48 smoothing :

Szero non min phase blip.jpgSzero  min phase.jpg

You can see that one of them shows the same sort of "blip" at that frequency. Please ignore the spikes / wiggles at lower frequencies, this is just noise.

I haven't run into many headphones where these phenomena occur - including a few multi drivers IEMs, but I haven't measured a lot of them - but they occasionally do (ex Beyer DT 900 Pro X at the 4kHz dip).
My question is whether you can derive/reconstruct either the original Dirac delta IR or the CSD that is typically plotted using the IR by using only the FR as a data set. I'm contending that you are working with incomplete information and making assumptions as a result when working solely with the FR graph, therefore it's more accurate to say that the Dirac IR is all the data you need to get a very accurate assessment of how something is going to sound.
 
Apr 28, 2024 at 4:27 AM Post #266 of 283
My question is whether you can derive/reconstruct either the original Dirac delta IR or the CSD that is typically plotted using the IR by using only the FR as a data set. I'm contending that you are working with incomplete information and making assumptions as a result when working solely with the FR graph, therefore it's more accurate to say that the Dirac IR is all the data you need to get a very accurate assessment of how something is going to sound.
The necessary assumption is simply that the IEM is minimum-phase. With this assumption in place, you can calculate the IR from the FR (not even full FR, but just the magnitude response). Once that assumption is in place, the rest is just solid maths that everyone working in signal processing should know.
 
Apr 28, 2024 at 4:32 AM Post #267 of 283
I think it makes sense that those artifacts could possibly be recorded on the FR graph during the FFT, but you wouldn't possibly be able to parse what that means without seeing the CSD graph putting those artifacts into context.
The idea is that you can fully reconstruct the CSD from the FR, in a linear time-invariant system. And with minimum-phase systems (which by definition are linear time-invariant), you can reconstruct the CSD from magnitude response alone, without the need to know phase information at all. Both of these are just well established mathematical results. Indeed, at times it could be helpful to reconstruct the CSD from FR, so that time-domain information is more clearly presented to the reader. But that doesn't mean the information is not already contained in the FR.

Strictly speaking, IEMs aren't minimum-phase or even linear time-invariant. It is indeed an assumption. But that assumption is justified and reasonable, because the deviation of most IEMs from a minimum-phase system is very small and probably negligible.
 
Apr 28, 2024 at 5:29 AM Post #268 of 283
it's more accurate to say that the Dirac IR is all the data you need to get a very accurate assessment of how something is going to sound.
I’m not sure I really understand your difficulty/argument but the obvious question that springs to mind from this assertion is; what happens if you take that Dirac IR, perform a FFT on it and with that result then perform an inverse FFT? In other words, if the “Dirac IR is all the data you need”, how is the freq information (response) derived by a FFT of that IR not also “all the data you need”?

G
 
Apr 28, 2024 at 5:50 AM Post #269 of 283
and its really not my problem if some objetivitsts feel "attacked" in their worldview or whatever
Duh, of course it is! Our “worldview or whatever” is the researched, proven, demonstrated science/facts, so if you come to a sound Science forum spouting BS that you yourself made-up, which is contrary to the actual science/facts, that absolutely is YOUR problem.

G
 
Apr 28, 2024 at 6:07 AM Post #270 of 283
I’m not sure I really understand your difficulty/argument but the obvious question that springs to mind from this assertion is; what happens if you take that Dirac IR, perform a FFT on it and with that result then perform an inverse FFT? In other words, if the “Dirac IR is all the data you need”, how is the freq information (response) derived by a FFT of that IR not also “all the data you need”?

G
The way I am understanding this, the problem is with the inverse of the causal relationship between IR and FR not necessarily being true.

If I'm mistaken at any point, please correct me. IR by definition contains three dimensions of information (frequency, amplitude, time), thus has all the information required to derive other metrics that rely on some or all of these dimensions. Running the IR through a FFT to get the FR requires no assumptions because all facts are in evidence and the amount of information being presented is being reduced, thus making the conclusion valid and sound.

In this specific instance, the argument as I understand it is that FR is the only metric required to accurately assess the sound of a particular transducer. I believe this is an unsound proposition because a comprehensive assessment requires looking at the transducer's performance across the aforementioned three dimensions and the FR is by definition measured across only two of those dimensions (frequency and amplitude). It's not invalid in my assessment because the explicit assumption in the premise (that the transducer in question is in fact minimum phase) is probable but not guaranteed, thus requiring this fact to be established as evidence before considering the inverse causal relationship to be correct as well.

I thus argue that the FR is not enough information because extrapolating the time domain from this metric requires assuming facts not in evidence.
 

Users who are viewing this thread

Back
Top